
Meta Platforms (META)
Equity Research


Disclaimer
The analyses and conclusions contained in this report are based on publicly available information. There may be confidential or otherwise nonpublic information in the possession of the companies discussed in this report that could lead these companies and others to disagree with these analyses, conclusions and opinions.
This report may include forward-looking statements, estimates, and projections which reflect various assumptions that may not be accurate.
The content expresses the views of the author as of the time of writing and such views are subject to change. This report and the information contained herein is not investment advice or a recommendation or solicitation to buy or sell any securities. Past performance is not indicative of future results. All investments involve risk, including loss of principal.
Overview
Ticker: META
Stock Price: $598.86
Builds products that connect and share across mobile, PCs, VR headsets, and AI glasses
Founded 2004; IPO 2012
FY2025 revenue of $200.97B (+22% YoY)
Family of Apps 98.9% of revenue ($198.76B); Reality Labs 1.1% ($2.21B)
Advertising $196.18B; other $2.58B
Market capitalization of ~$1.52T
Mark Zuckerberg, founder, chairman, and CEO since 2004 (~22 years)
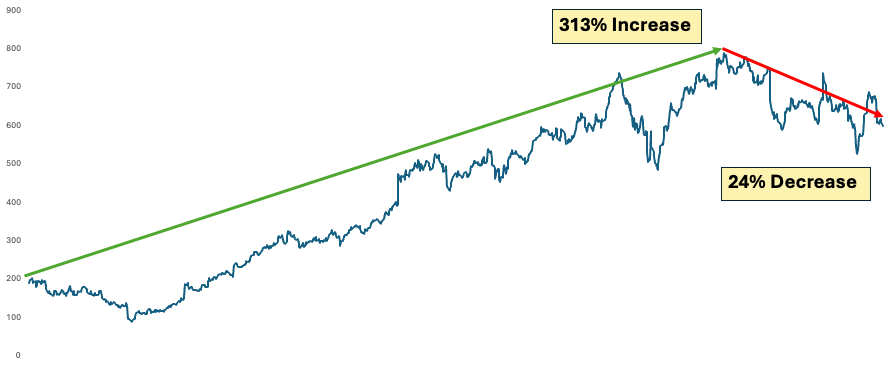
4 Year Stock Performance (since May 2021)
Revenue
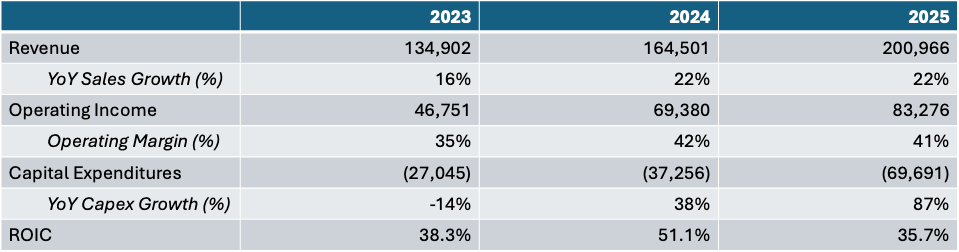
Capex has grown 87% YoY – far outpacing revenue growth (22%) but operating margins have fallen by only 1%.
Meta has shown they can still maintain strong operating margins while spending aggressively due to their high ROIC.
FY2025 Revenue Breakdown
By segment (FY2025 revenue: $200.97B)
Family of Apps: $198.76B (98.9%)
Reality Labs: $2.21B (1.1%)
By line item
Advertising: $196.18B
Other: $2.58B
By customer billing geography
US & Canada: $78.87B (39.2%)
Asia-Pacific: $53.82B (26.8%)
Europe: $46.57B (23.2%)
Rest of world: $21.71B (10.8%)
Industry Overview
Digital advertising and social-media attention markets
Smaller, growing exposure to consumer AI and VR/AR hardware and software
Largest scaled players: Alphabet, Amazon, Snap, Pinterest, and ByteDance via TikTok
Peer 2025 advertising scale
Alphabet Google advertising: $294.69B
Amazon advertising services: $68.64B
Snap total revenue: $5.93B; Pinterest total revenue: $4.22B
TikTok: more than 1B monthly users globally; >200M monthly users in Europe
Structural shift
Move beyond 2D screens toward mixed reality and AI; AI-optimized data-center capacity is becoming the key infrastructure layer
Industry Market Dynamics
Rivalry: high
Meta cites direct competition from TikTok and products that appeal to younger users
Large ad budgets also contested by Alphabet and Amazon
Threat of new entrants: low; Buyer power: medium to high
$131.05B of non-cancelable contractual commitments (cloud, servers, networks, data centers, RL hardware) raise barriers
Marketers generally do not have long-term commitments and many spend only a small share of total budgets
Supplier power: medium and rising; Substitute pressure: high
AI infrastructure now requires large purchases of chips, fiber, cloud, power, and construction capacity
Marketing budgets can move among search, retail media, short-form video, streaming, and other channels
Core Product Portfolio
Family of Apps (98.9% of FY2025 revenue)
Facebook, Instagram, Messenger, WhatsApp, and Threads
Q1 2026: 3.56 billion Family daily active people on average for March 2026
Substantially all revenue is generated from advertising on Facebook and Instagram
Reality Labs (1.1% of FY2025 revenue)
VR/AR hardware and software business; remains loss-making but strategically important
Built on the 2014 Oculus acquisition; ships Quest headsets and Ray-Ban Meta smart glasses
AI stack
Meta AI assistant, Llama open-source model family, Muse model family from Meta Superintelligence Labs
Company says it has broken ground on 10 data centers in the last 24 months for AI-optimized capacity
Competitive Standing
Largest direct competitive position is in social attention and ad delivery
3.56 billion Family daily active people in March 2026 — among the largest user bases of any consumer platform
Owns several of the world’s largest consumer apps and ad-delivery systems
Position differs by rival
Alphabet leads search-intent and scaled video via YouTube; Amazon owns commerce-intent inventory near point of purchase
TikTok has a powerful short-video recommendation engine and large attention share with younger users
Snap holds AR-oriented positioning with younger audiences; Pinterest holds explicit commercial-intent discovery
Direction of advantage looks stable
Better: ad impressions and average price per ad both rose in Q1 2026; AI ranking and ad tools improving
Worse: Reality Labs remains loss-making, switching costs are limited, and US/EU regulatory pressure remains high
Competitive Advantage
Network effects: high
3.56 billion Family daily active people; users and advertisers reinforce each other across Facebook, Instagram, Messenger, WhatsApp, and Threads
Intangible assets: high
Owns several of the world’s largest consumer apps and ad-delivery systems; AI ranking and Advantage+ tools showed measurable conversion improvements
Barriers to entry: high
$131.05B of non-cancelable contractual commitments and large compliance burdens; 2026 capex guided $125–$145B
Cost advantage: medium
Scale benefits in ad inference, measurement, and infrastructure — partly offset by very large ongoing capex; switching costs are low for users and low-to-medium for advertisers
Upcoming Catalysts
Near-term reporting and corporate events
May 27, 2026 annual meeting
Q2 2026 revenue guided to $58B–$61B
Q1 2026: revenue $56.31B; ad impressions and average price per ad both rose
AI infrastructure build and product roadmap
2026 capex range raised to $125B–$145B (from $115B–$135B)
April 30, 2026: $25B of investment-grade bonds issued to fund AI infrastructure
Muse model family launched as first products from Meta Superintelligence Labs
Strong Financial Position
Balance sheet: medium gross leverage, low net leverage
March 31, 2026: $58.75B long-term debt; $81.18B cash, equivalents, and marketable securities
Net cash position before April 30 financing; $25B bond issuance subsequently raised gross debt with corresponding cash
Cash flow generation
Q1 2026 operating cash flow: $32.23B
Q1 2026 free cash flow: $12.39B (after $19.84B of capex)
Reinvestment intensity: high
FY2025 capex: $72.22B; 2026 capex guidance raised to $125B–$145B
Share repurchases and dividends continued alongside elevated AI and hardware investment
Why it trades at a deep discount
AI investments need to prove they will produce attractive returns
AI has already shown to improve advertising effectiveness
The plan for monetization is not totally laid out yet but there are some clear opportunities
Shopping in Facebook and Instagram has been successful and Meta AI has the possibility of enhancing that experience for users if it’s good (which Muse Spark has shown it is)
Competitors are pursuing similar strategies
“We’re already testing an early version of business AIs, and weekly conversations have grown 10x since the start of this year.” – Mark Zuckerberg, Q1 2026 earnings call
AI investments reduce income available to shareholders
Meta has historically had high ROIC (>30%)
Meta has high margins with a strong balance sheet, allowing for cheap financing of capital, reducing interest expenses
Being a tech company, they can fully leverage AI for productivity and efficiency gains to help offset capital expenditures (more regulated industries have to be careful)
Reality Labs has wide losses
While the Metaverse has failed, smart glasses have done extremely well
“Our AI glasses continue to perform well with the number of people using them daily tripling year-over-year.” – Mark Zuckerberg, Q1 2026 earnings call
You win some, you lose some
“We remain the biggest investor in the VR space across the industry, but we are focused on making our VR business sustainable as we invest more in other areas like AI and glasses.” – Mark Zuckerberg, Q1 2026 earnings call
Management has acknowledged it and is taking steps to correct it
Legal and Regulatory
Both voters and lawmakers have unfavorable views on social media
It is unlikely these issues are resolved in Meta’s favor, which warrants a discount to historical valuation
Management
Founder-led with deep ownership alignment
Mark Zuckerberg, founder, chairman, and CEO since 2004 (~22 years); controlled 60.8% of voting power as of April 1, 2026
$1 salary; does not participate in the annual cash bonus plan
Broader executive team
Subject to stock ownership guidelines, but the annual cash bonus framework is committee-discretionary and tied to broad priorities rather than explicit operational milestones
Capital allocation evidence
Willingness to fund operating priorities (capex rose from a 2023 plan of $34–39B to a 2026 plan of $125–145B); share repurchases and dividends continue alongside elevated investment
Product launches: largely on time Ray-Ban Stories (2021), Quest Pro (2022), Quest 3 (2023), Llama 2 (2023), Llama 3 / Meta AI (April 2024) all shipped within stated windows
2022–23 cost reset achieved
”Year of efficiency”: headcount down 22% year over year by Q4 2023; management stated efficiency goals were achieved middle-management layers were reduced, and management declared the initiative achieved by early 2024
The cost reset worked: later expense guidance declined and management explicitly cited the leaner org as enabling faster execution
Reels and ads rebuild delivered, but slowly
By Q2 2023, Reels run-rate exceeded $10B; Advantage+ end-to-end revenue more than doubled YoY by Q1 2024
Weaker areas
Budget discipline and long-cycle disclosure
2025 capex revised from $60–65B to $70–72B; 2026 capex revised from $115–135B to $125–145B within a quarter
Reality Labs unit economics and “most-used AI assistant” benchmark remain unverified
Management has shown they operate as owners and understand what drives business value.
Earnings Growth
Meta guided to Q2 2026 revenue of $58B–$61B on the Q1 2026 earnings call (April 29, 2026)
Revenue trajectory: $134.90B (2023, +16%), $164.50B (2024, +21%), $200.97B (2025, +22%); Q1 2026 $56.31B
Q1 2026 ad impressions and average price per ad both rose; AI-driven ad ranking and Advantage+ tools showed measurable conversion improvements
Industry: digital advertising remains the dominant pool, with consumer AI and VR/AR as adjacent growth vectors
3.56B Family DAP gives the largest reachable ad audience among scaled peers
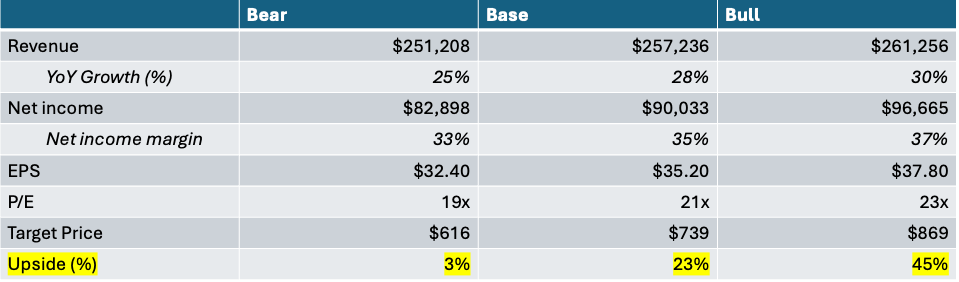
Valuation – 80% confidence range
Risks
Concentration in advertising
Substantially all revenue is from advertising on Facebook and Instagram; advertisers lack long-term commitment. Severity: Medium
Downturn in spending because of recession unlikely
AI has shown it works in advertising
Competition for users and ad budgets
TikTok and other platforms strong with younger users; Alphabet and Amazon contest large ad budgets. Severity: Medium
Regulatory, litigation, and antitrust exposure
EU/US matters across privacy, content, youth safety, AI, and competition could significantly affect results. Severity: Medium | Probability: High
Capital intensity and AI execution risk
2026 capex raised from $115–135B to $125–145B in one quarter; predictability has weakened. Severity: High
Meta Platforms: Summary Investment Thesis
Massive scale: 3.56B Family DAP and FY2025 revenue of $200.97B (+22% YoY)
Wide moat: high network effects, intangibles, and barriers to entry; advantage looks stable
Strong cash generation: Q1 2026 OCF $32.23B
High return on invested capital
Demonstrated operating discipline: 2023 ‘year of efficiency’ delivered
Meta smart glasses have been a huge success and provide another point of AI interaction
Have accepted Reality Labs shortcomings and taken steps to pivot
AI has proven to improve advertising + promising early signs from Muse Spark / Meta AI
Market is pricing in a bear scenario leaving asymmetric upside
Meta is a good business, in a good industry, with good management, at a good price.